Native American Population Statistics: Demographics & Tribal Distribution – A Resurgent Narrative
The demographic landscape of Native America is a tapestry woven with threads of resilience, historical trauma, and vibrant resurgence. Far from a vanishing people, the Indigenous population of the United States presents a complex, dynamic, and growing profile, challenging outdated narratives and underscoring the enduring presence of sovereign nations. Understanding these statistics is not merely an academic exercise; it is crucial for effective policy-making, resource allocation, and recognizing the distinct identities of hundreds of tribal communities.
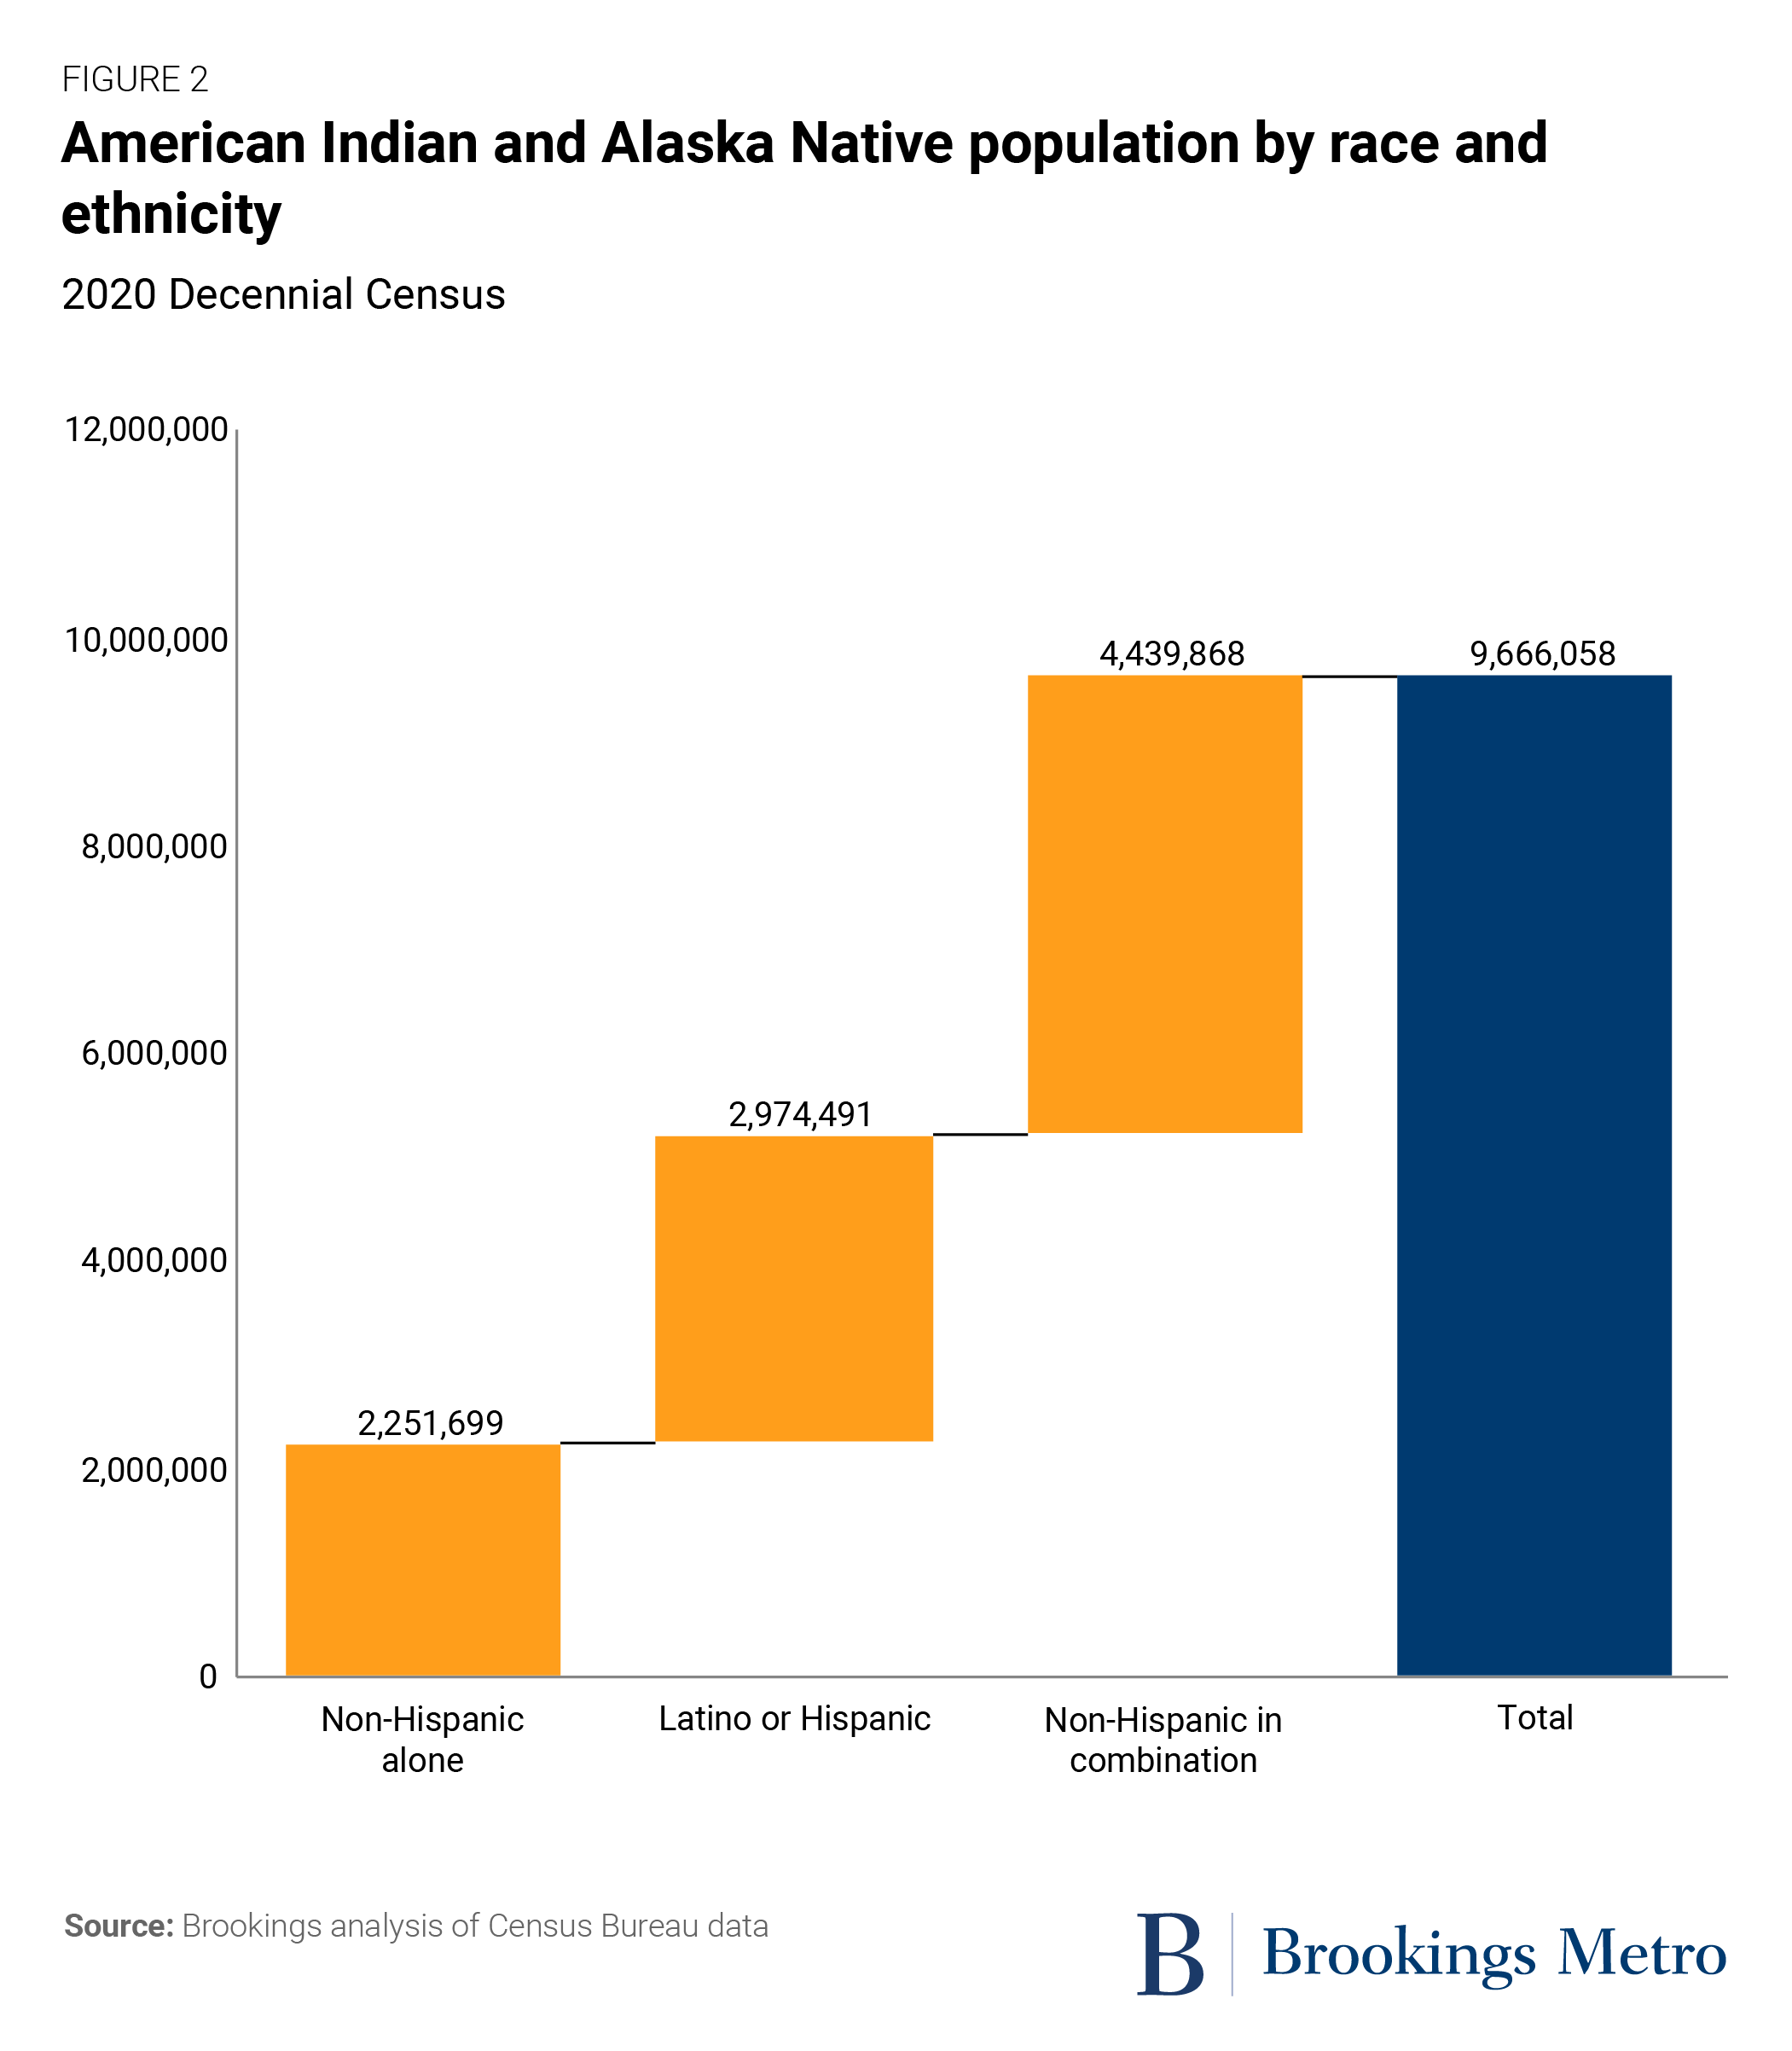
According to the U.S. Census Bureau’s 2020 data, the population identifying as American Indian or Alaska Native (AIAN) alone was 3.7 million, representing 1.1% of the total U.S. population. However, a more comprehensive figure emerges when considering those who identify as AIAN in combination with one or more other races. This "alone or in combination" category soared to 9.7 million people in 2020, an astonishing 160% increase from the 2010 figure of 5.2 million. This significant growth is not solely attributable to higher birth rates, though that plays a role; it is substantially driven by an increasing propensity for individuals to self-identify with their Native heritage, reflecting a broader cultural revitalization and a more inclusive approach by the Census Bureau.
A Historical Trajectory of Decline and Recovery
To grasp the significance of current figures, one must briefly acknowledge the catastrophic historical context. Pre-Columbian estimates suggest that millions of Indigenous people inhabited North America – potentially 5 to 10 million in what is now the U.S. alone. Following European contact, disease, warfare, and genocidal policies decimated these populations. The nadir was reached around 1900, when the AIAN population plummeted to an estimated 250,000, representing a staggering 90-95% reduction from pre-contact levels. The subsequent century, however, marked a slow but steady recovery, accelerating dramatically in recent decades. This demographic rebound is a powerful testament to survival and cultural persistence against overwhelming odds.
Unpacking the Demographics: A Deeper Dive

The AIAN population exhibits distinct demographic characteristics when compared to the general U.S. population.
Age Structure: The Native American population is notably younger. The median age for AIAN individuals in 2020 was approximately 31.2 years, significantly younger than the national median of 38.8 years. This younger age structure implies a higher potential for future population growth but also highlights the critical need for investments in education, youth programs, and healthcare services tailored to younger cohorts within Native communities.
Urbanization: A persistent stereotype portrays Native Americans primarily residing on reservations. While reservations remain central to tribal sovereignty and cultural identity, the reality of contemporary Indigenous life is far more complex. Over 70% of Native Americans now live in urban or suburban areas, a trend that has accelerated since the mid-20th century due to federal relocation policies and the pursuit of economic opportunities. This urban migration has created vibrant, yet often less visible, Indigenous communities in cities like Los Angeles, Phoenix, Oklahoma City, and Minneapolis, where "urban Indians" often navigate dual identities and face unique challenges in maintaining cultural connections. They are, as some scholars note, an "invisible minority" in many urban settings, making accurate data collection and targeted services particularly challenging.
Multiracial Identity: The surge in the "alone or in combination" category is a defining feature of modern Native American demographics. This reflects evolving societal attitudes, the increasing acceptance of mixed heritage, and changes in how individuals perceive and express their identity. It also poses complexities for data interpretation, as tribal enrollment requirements often differ from federal self-identification standards. For example, an individual may identify as AIAN on the Census but not be eligible for enrollment in a federally recognized tribe due to blood quantum requirements or other tribal specific criteria. This growing multiracial identification highlights the fluidity and evolving nature of race and ethnicity in America, particularly for Indigenous peoples.
Socioeconomic Indicators: Despite the population resurgence, significant socioeconomic disparities persist. Native Americans continue to experience higher rates of poverty (often twice the national average), lower median household incomes, and lower educational attainment compared to the general population. Health disparities are also pronounced, with higher rates of diabetes, heart disease, and lower life expectancies. These statistics underscore the intergenerational impacts of historical trauma, systemic discrimination, and chronic underfunding of Native American communities and programs. Addressing these disparities requires data-driven, tribally-led initiatives that acknowledge the unique historical and contemporary challenges faced by Indigenous peoples.
Tribal Distribution: A Mosaic of Sovereign Nations
The term "Native American" encompasses an extraordinary diversity of cultures, languages, and governance structures. There are 574 federally recognized American Indian and Alaska Native tribes in the United States, each with its own distinct history, traditions, and sovereignty. Additionally, numerous state-recognized tribes and un-recognized Indigenous communities exist, further complicating a neat statistical overview.
Largest Tribal Nations: While there are hundreds of distinct tribes, some have significantly larger populations:
- Cherokee Nation: Often cited as the largest, the Cherokee people are represented by three federally recognized tribes: the Cherokee Nation, the United Keetoowah Band of Cherokee Indians in Oklahoma, and the Eastern Band of Cherokee Indians in North Carolina. Combined, their enrolled members number over 400,000, with many more identifying as Cherokee on the Census. The complexity of the "Cherokee" identity is a prime example of the challenges in relying solely on Census data versus tribal enrollment figures.
- Navajo Nation: The largest in terms of land area (over 27,000 square miles across Arizona, New Mexico, and Utah) and one of the largest by enrolled population, with over 300,000 citizens. Its sheer size and concentrated population make it a significant demographic and political entity.
- Choctaw Nation of Oklahoma: Another large and historically significant tribe, with over 200,000 enrolled members.
- Ojibwe (Chippewa) and Sioux (Lakota, Dakota, Nakota): These large, culturally related groups encompass numerous distinct federally recognized tribes spread across the Great Lakes and Great Plains regions, respectively, with combined populations in the hundreds of thousands.

Geographic Concentrations: While Native Americans reside across all 50 states, certain regions exhibit higher concentrations:
- Oklahoma: Home to the largest number of federally recognized tribes (39), primarily due to forced removals in the 19th century.
- Arizona and New Mexico: High concentrations of Pueblo, Navajo, Apache, and other Southwestern tribes.
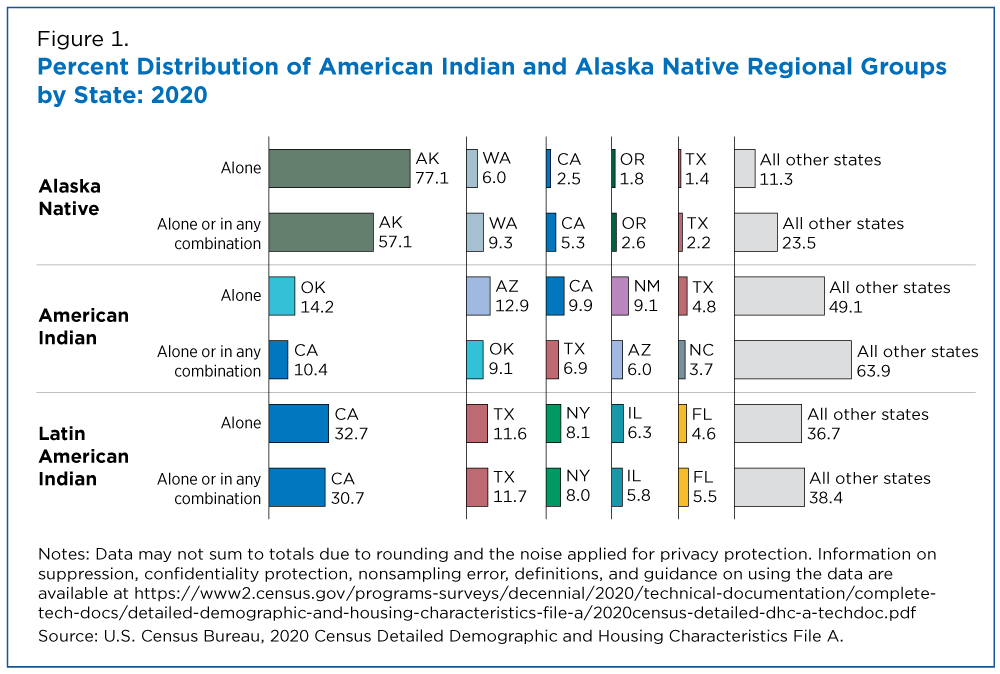
- California: Has the largest total AIAN population of any state, reflecting both historical presence and significant urban migration.
- Alaska: The vast majority of its Indigenous population is Alaska Native, encompassing diverse groups like the Yup’ik, Inupiaq, Athabascan, and Tlingit, among others.
- The Northern Plains (e.g., South Dakota, North Dakota, Montana): Home to numerous Sioux, Cheyenne, and other Plains tribes.
- The Pacific Northwest (e.g., Washington, Oregon): Significant populations of Coast Salish, Nez Perce, and other tribes.
This geographic distribution reflects both pre-contact territories and the enduring impacts of federal policies like the Indian Removal Act and the reservation system.
The Importance of Tribal Data Sovereignty
The collection and interpretation of Native American population statistics are not without their complexities and controversies. Historically, data about Indigenous peoples was often collected by non-Native entities, sometimes with extractive or harmful intentions. Today, there is a growing movement for "tribal data sovereignty," asserting that tribes have the right to govern their own data, from collection to analysis and dissemination. This ensures that data accurately reflects tribal realities, serves tribal priorities, and respects cultural protocols. For example, the Census Bureau now works more closely with tribal governments to ensure accurate counts, particularly on reservations, which have historically been undercounted.
Conclusion: An Enduring and Evolving Presence
The statistics of Native American populations paint a vivid picture of a people who have not only survived but are thriving and growing. From a historical low point, the Indigenous population has demonstrated remarkable resilience, experiencing significant growth driven by both biological factors and an increasing pride in self-identification. This demographic resurgence is accompanied by an ongoing process of urbanization, a complex multiracial identity, and persistent socioeconomic challenges that demand targeted and culturally competent solutions.
The 574 federally recognized tribes, along with numerous other Indigenous communities, form a rich mosaic of sovereign nations, each with a distinct identity and contribution to the fabric of the United States. Understanding the nuances of their demographics and distribution is essential to recognizing their enduring presence, honoring their sovereignty, and supporting their continued self-determination. The numbers tell a story not of decline, but of an enduring and evolving people, a powerful narrative of survival, adaptation, and revitalization in the 21st century.


